
How to pick an exact score
A points game, not money betting. Uncle Predictor involves no money, accepts no deposits and pays out no cash prizes. Nothing on this page is betting advice.
Predicting "Benfica to win" is an opinion. Predicting "Benfica 2-1" is a decision. This guide is about the second one — and about the fact that most people make it without thinking, writing the same two or three scores every time. We know that's how it goes because we went and checked.
Half of all matches fit into six scores
The 2026 World Cup had 104 matches. The six most frequent scorelines covered exactly half of them:
| Score | Matches | % of matches |
|---|---|---|
| 1-1 | 12 | 11.5% |
| 2-1 | 9 | 8.7% |
| 2-0 | 8 | 7.7% |
| 0-1 | 8 | 7.7% |
| 0-0 | 8 | 7.7% |
| 1-0 | 7 | 6.7% |
| Total | 52 | 50.0% |
This has a practical consequence: the gap between the most likely score and the second most likely is small. You're not choosing between a good option and a bad one — you're choosing between two options that look very much alike. And when two options are worth almost the same in probability, the tiebreaker stops being about football.
What people write is not what the ball does
Across those same 104 matches we recorded 4,305 predictions. Comparing the two distributions — what was written and what actually happened — gives you the most useful chart in this guide:
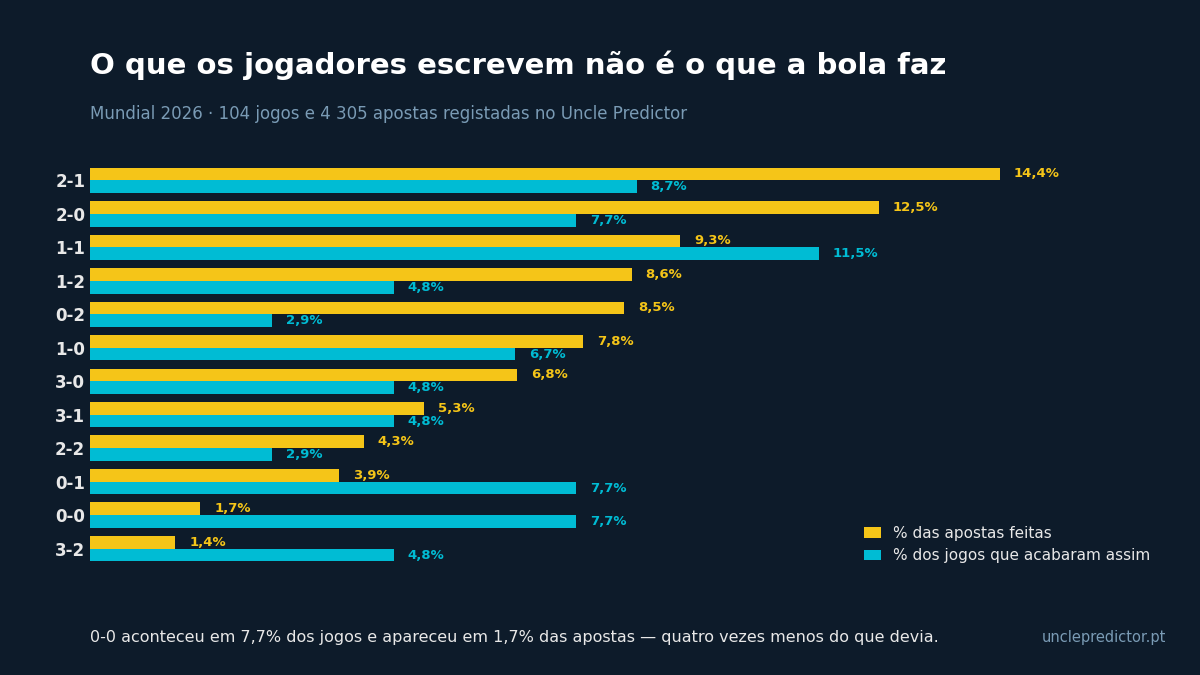
2-1 was the most-written score, appearing in 14.4% of predictions — but it only happened in 8.7% of matches. 2-0 shows up in 12.5% of predictions against 7.7% of real occurrences. These are the two automatic reflexes of someone who has an opinion about the winner but not about the goals.
At the opposite extreme sits 0-0. It happened in eight matches — the same eight as 2-0 — and received 75 predictions against 536 for 2-0. Seven times fewer predictions for the same real-world frequency.
| Score | % of matches | % of predictions | Reading |
|---|---|---|---|
| 0-0 | 7.7% | 1.7% | Written 4.4× less than it should be |
| 3-2 | 4.8% | 1.4% | Written 3.6× less |
| 0-1 | 7.7% | 3.9% | Written 2.0× less |
| 0-2 | 2.9% | 8.5% | Written 2.9× more than it should be |
| 2-1 | 8.7% | 14.4% | Written 1.7× more |
| 2-0 | 7.7% | 12.5% | Written 1.6× more |
Draws are the biggest hole
23.1% of matches ended in a draw. Draws were picked on just 15.6% of slips. That's roughly a third missing — and it isn't carelessness, it's psychology. Writing down a draw feels like "not choosing". Anyone with an opinion about a match feels obliged to translate it into a winner, even when the honest opinion is "this one is really evenly balanced".
The question that decides half of all correct calls
Of the 4,305 predictions, 59.1% got the outcome right — who would win, or the draw. Only 9.6% got the exact score right. Six out of ten people read the match well, and one in ten takes home the full prize.
Everything that stands between those two numbers is goals. And in practice, most of that distance comes down to a single question: does the opponent score? That's what separates 2-0 from 2-1, 1-0 from 1-1, 3-0 from 3-1. Notice the question isn't about the favourite's attack — it's about whether the other side can find a goal. A team that has conceded in every match of the tournament will probably concede again, whoever they play.
Four questions before you lock in your prediction
- Who wins? Get this wrong and the rest is worth zero, whatever else happens. Without conviction, the draw deserves serious consideration.
- How many goals does the favourite score? The useful question isn't how good the attack is, but how well the opponent shuts up shop.
- Does the opponent score? This is what separates 2-0 from 2-1 and decides half of all exact-score hits.
- Will this score be on lots of slips? If yes, and your conviction is weak, look at the adjacent score.
Unlikely is not the same as unpopular
There's a difference here that's worth points and that a lot of people muddle. An unlikely score is one that rarely happens — 5-1, 0-4. An unpopular score is one that happens at a normal rate but that almost nobody writes down. 0-0 is the perfect example: there's nothing unlikely about it, it happened in almost 8% of matches, and even so it's practically invisible on people's slips.
Your job isn't to hunt for freakish scores. It's to hunt for scores that are plausible but that most people won't write. Putting 5-1 on everything isn't boldness — it's losing points with style.
How to read these numbers with care
Two honest caveats. The first is the sample: 104 matches isn't much, and a score that happened five times could have happened three or seven times without anything odd going on. The big differences — the 0-0, the draws — are reliable; the small ones are not.
The second is the format. A World Cup is not a league season. There were 2.96 goals per match, above what's normal in a European league, because the group stage pits very mismatched national teams against each other. And although the first-listed team won 48.1% of matches against 28.8% for the second, that isn't home advantage: at a World Cup it mostly reflects the draw order, which tends to put the stronger team first. In club competitions, where home and away actually mean something, the pattern will have a different origin.
Summary
- Half a dozen scores cover half of all matches: the options sit close together.
- Getting the winner right is the decision that weighs most — 59.1% manage it, but only 9.6% reach the exact score.
- Almost all of the distance between the two lies in "does the opponent score?".
- Draws are underrepresented on slips by about a third; 0-0, by 4.4 times.
- Between two scores of similar probability, pick the less popular one.
- Trade popularity for rarity — never real probability.
Data: 104 matches and 4,305 predictions from the 2026 World Cup recorded on Uncle Predictor, compiled on 9 August 2026.